MLOps scalability

machine learning pipeline

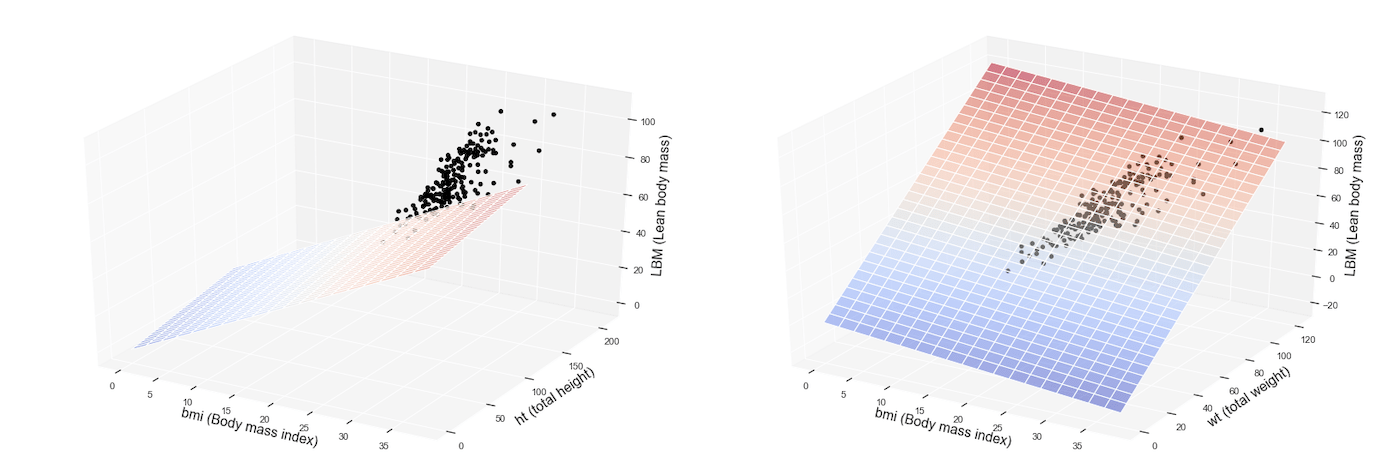
Nowadays Machine Learning (ML) techniques are applied in various industries, along with an increasing number of projects and complexity. This generates on one hand the need for greater governance, i.e. the ability to orchestrate and control the development and deploy over the entire ML life cycle (preprocessing, model training, testing, deployment), on the other hand, the need for scalability, i.e. being able to efficiently replicate entire parts of the process, in order to manage multiple ML models.

A recent USA research, carried out to understand the Machine Learning trends for 2021, has conducted a survey on a significant sample of 400 companies: 50% of these are currently managing more than 25 models of ML and 40% of the total runs over 50 ML models. Among large organizations (over 25,000 collaborators) 41% of them turned on to have over 100 ML algorithms in production!

Continue reading “MLOps scalability”
Multiple Linear Regression

MLR charts

In the previous post we have analyzed an example of simple linear regression: a set of machine learning algorithms and techniques able to predict an output variable given a single independent variable, therefore through a linear function like Y = c1 + c2X.

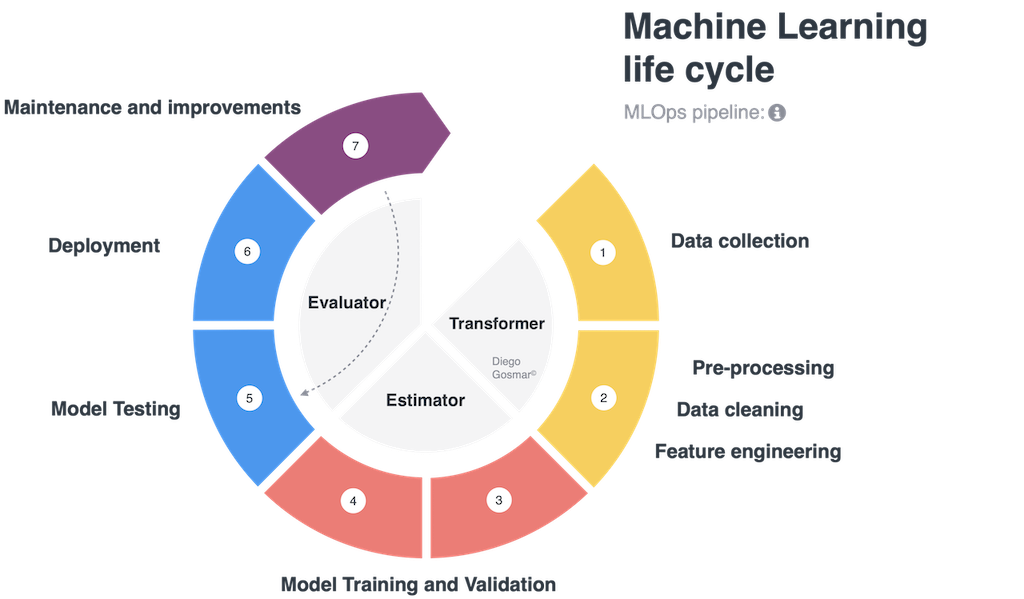
Today we are going to see its advanced extension, that is: how to predict Y as a function of multiple linear independent variables (X1, X2, X3 etc … etc …). This type of model is also called multiple linear regression (MLR).

We can reuse the dataset relating to blood tests carried out on Australian professional athletes related to various sports few years ago: reference Telford, R.D. and Cunningham, R.B. 1991 – sex, sport and dependence of hematology on body dimensions in highly trained athletes. Sports medicine and science 23: 788-794.

The dataset contains 13 features related to 202 observations.

AIS dataset

Here is the feature description:

Continue reading “Multiple Linear Regression”